A recent study investigated the agreement between heart rate variability derived from the photoplethysmographic signal of a commercially available smartwatch and heart rate variability derived from high-resolution electrocardiogram (gold standard) in patients with cardiovascular disease.
Heart rate variability (HRV) reflects the variation in heartbeat intervals and is a well-established noninvasive tool for assessing the functional status of the cardiac autonomic nervous system [2]. Autonomic nervous system dysfunction, often characterized by sympathetic nervous system overactivity and vagal withdrawal, plays a key role in the pathogenesis of several cardio- and cerebrovascular diseases and is therefore associated with a worse prognosis [3,4]. Accordingly, HRV measurements have been proposed for risk prediction in patients with cardiovascular diseases, including myocardial infarction, chronic heart failure, diabetes mellitus, ischemic stroke, and others [5–8].
Based on traditional standard HRV measurements in the time and frequency domains, a variety of nonstandard measurements [9] have been developed, including, among others, markers of short-time complexity [10], entropy [11], and Poincare plot analysis [12], deceleration capacity (DC) [13], and heart rate turbulence [14]. Although some of these measures have shown promising results as risk predictors in large clinical trials, HRV has rarely been used in clinical practice.
Even a 5-minute recording of the electrocardiogram (ECG) allows HRV analysis [2]. However, for the purpose of risk prediction, HRV analysis is usually performed with longer ECG recordings, especially when assessing HRV parameters that capture the low-frequency components of HRV. This may limit the applicability of HRV in daily life, especially if HRV is to be used as a continuous monitoring tool in an outpatient setting. With certain limitations, HRV can also be calculated from photoplethysmographic (PPG) pulse wave recordings [15]. Therefore, the increasing prevalence of wearables with integrated PPG sensors in the population may make PPG-based HRV analysis with commercially available smart devices a promising future approach. Two small studies in healthy populations have already demonstrated the general feasibility of smartwatch-based HRV markers [16,17]. However, the accuracy of smartwatch-derived PPG-based HRV in larger populations with cardio- or cerebrovascular disease who might benefit from continuous risk monitoring is unknown.
Therefore, the aim of a recent study was to determine the accuracy of standard and nonstandard HRV markers calculated from PPG recordings of a commercially available smartwatch compared with ECG-derived HRV metrics in a relevant number of patients with cardio- and cerebrovascular disease [1].
Study design and participants
The study included three different cohorts presenting to a cardiology outpatient clinic between June 2021 and July 2022: Patients after ST-elevation myocardial infarction (STEMI cohort), patients after ischemic stroke (STROKE cohort), and patients without known structural cardiovascular disease (CONTROL cohort).
Inclusion criteria for the STEMI cohort were patients with a first STEMI treated with primary percutaneous coronary intervention within 24 hours of symptom onset. Inclusion criteria for the STROKE cohort were patients with acute ischemic stroke confirmed by computed tomography or magnetic resonance imaging with symptom onset within 30 days before hospital admission. The CONTROL cohort included patients without a known history of manifest structural cardiovascular disease. The general inclusion criteria included an age ≥18 years and the presence of sinus rhythm. Patients with frequent premature ventricular beats (>10% of total beats) or poor quality were excluded.
Recordings and signal processing
ECG and PPG were recorded simultaneously for 30 minutes in all subjects. Recordings were made under standardized conditions in the supine position and during spontaneous breathing. External stimuli (noise, etc.) were kept to a minimum and patients were instructed to relax.
Of the 282 subjects in whom simultaneous ECG and PPG recordings were performed, 263 subjects met the inclusion criteria and were enrolled in the study. Of these, 104 had STEMI, 129 had stroke, and 30 were in the CONTROL cohort. The mean age of the total cohort was 61 years and 71 (27%) were female. The median recording time was 32.1 minutes. In the STEMI and STROKE cohorts, recordings were made three days and five days after the index events, respectively. HRV measures were significantly lower in the STEMI and STROKE cohorts compared with the CONTROL cohort (P<0.05 for all except DF-α2).
Heart rate variability assessment
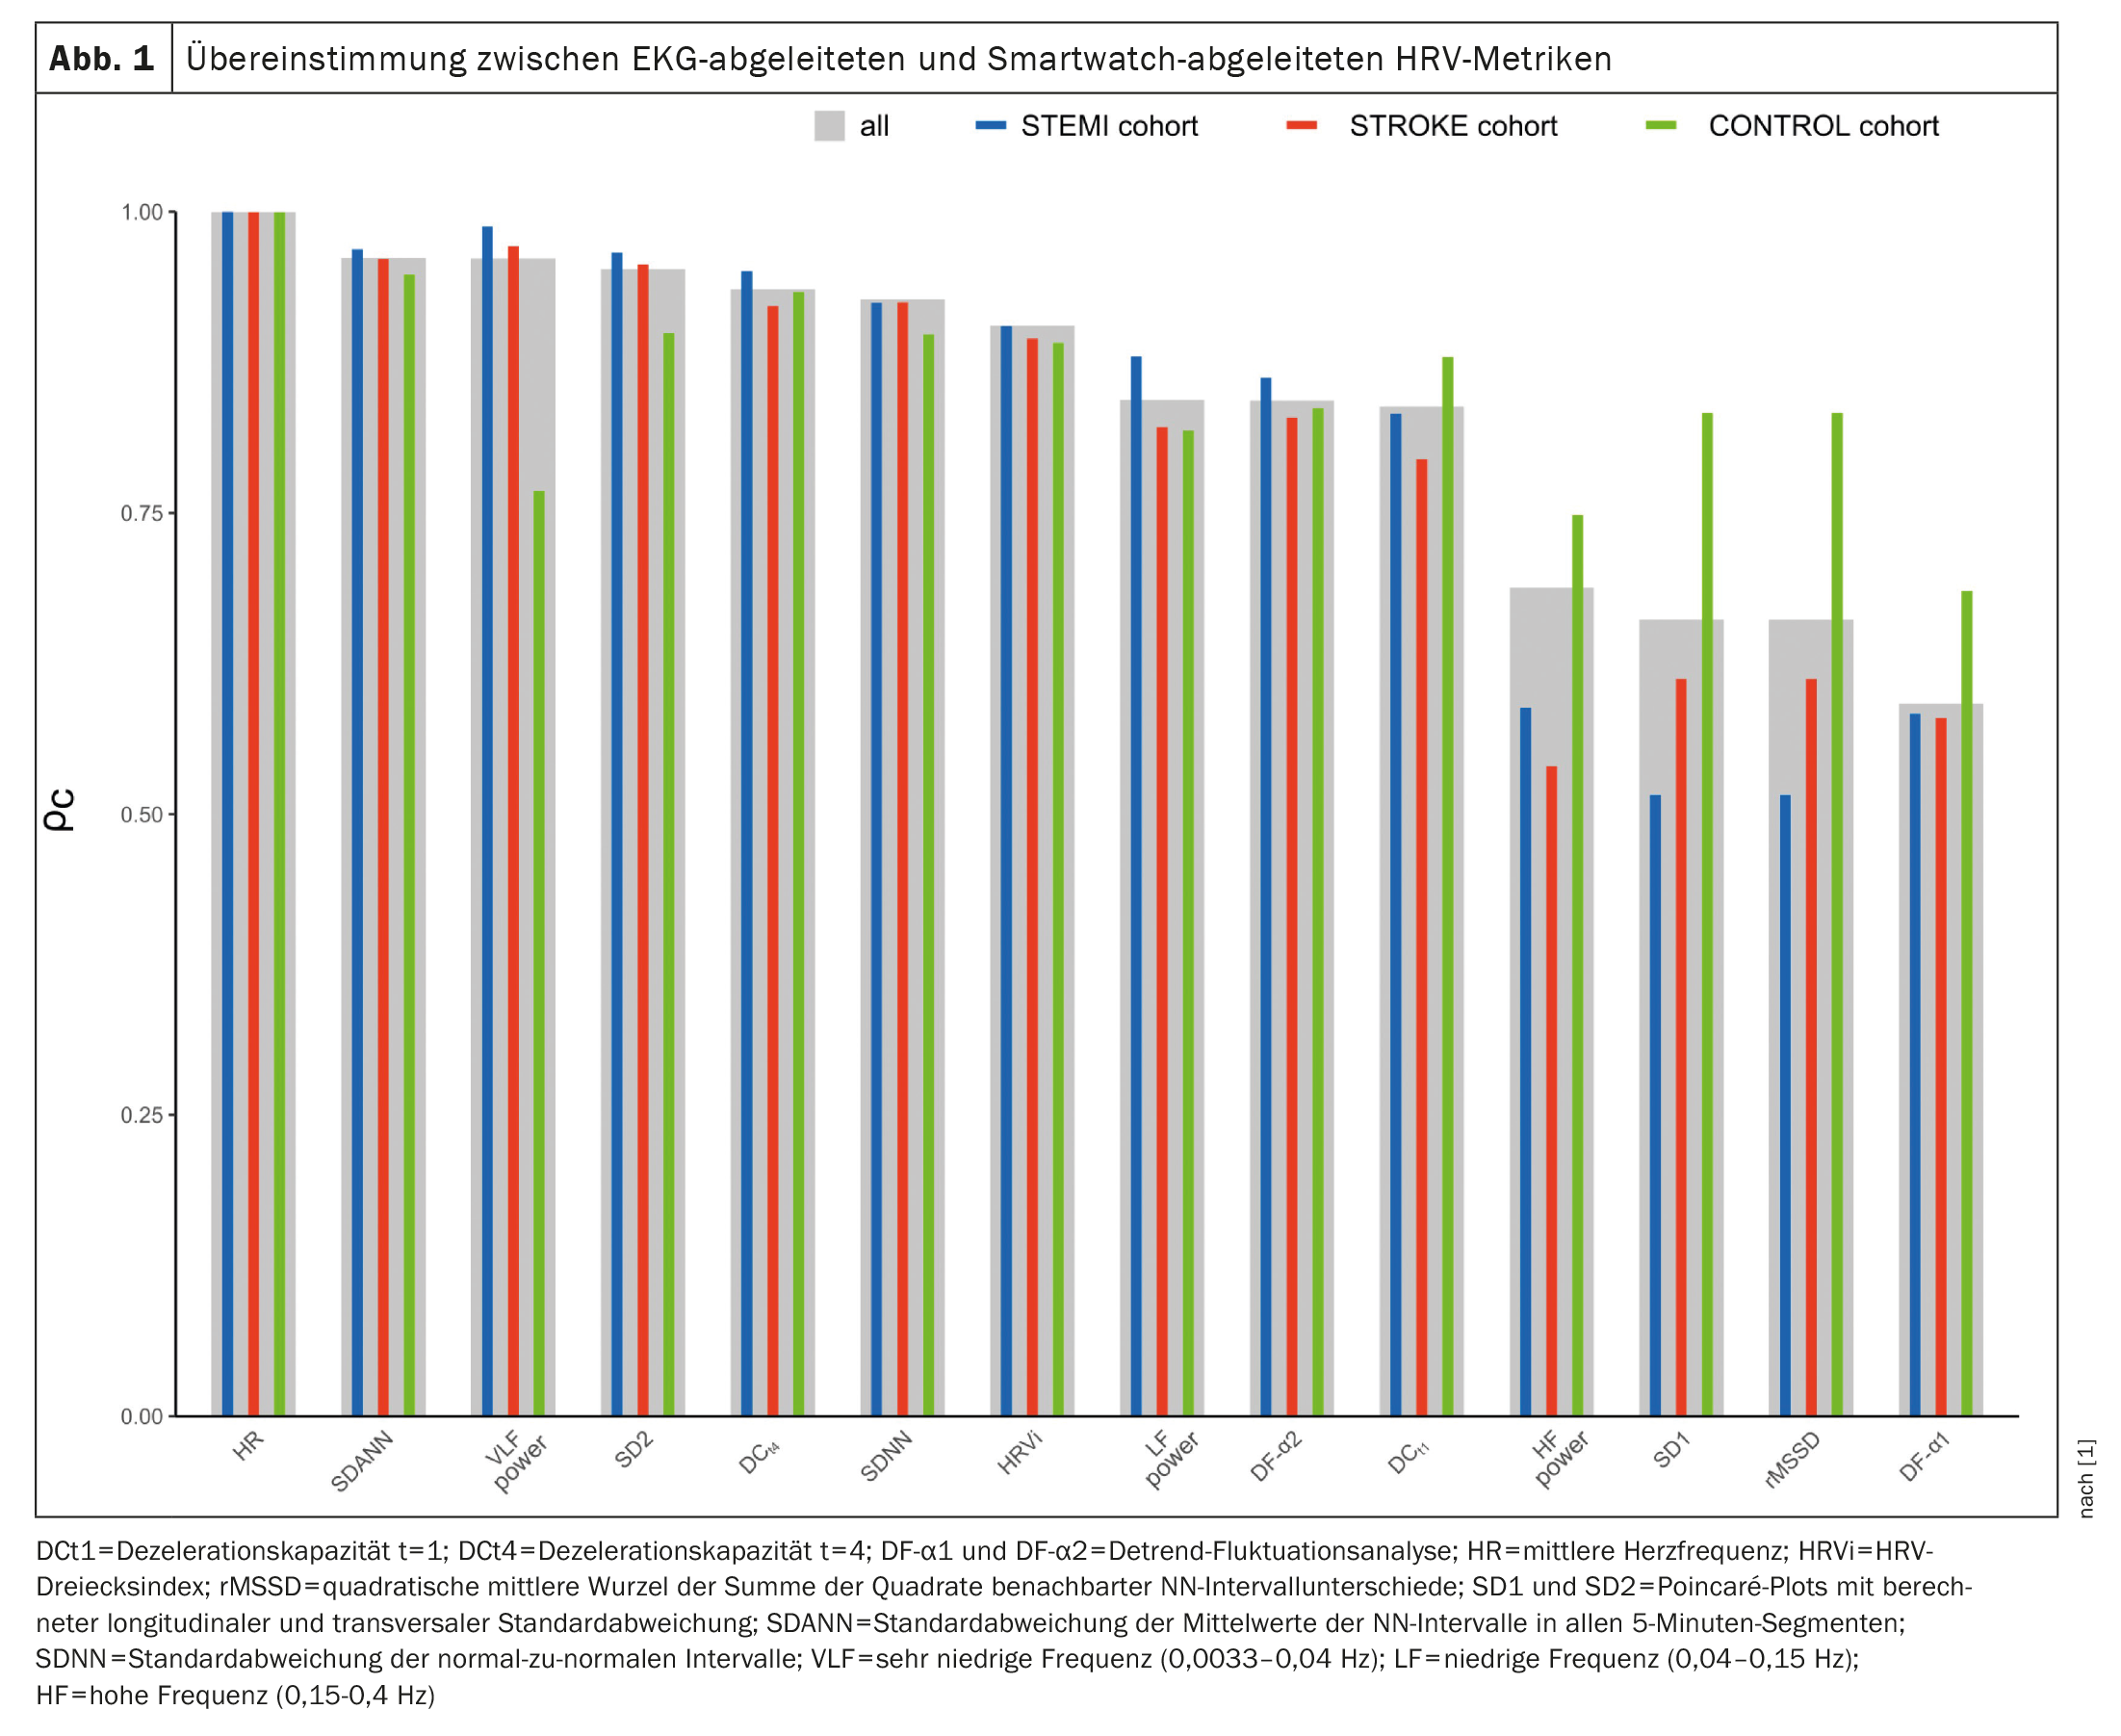
Agreement between PPG and ECG measurements was assessed by Lin’s concordance correlation coefficient (ρc), intraclass correlation coefficient (ICC; two-way mixed effects model), mean absolute error (MAE), mean absolute percent error (MAPE), and Bland-Altman plots with calculated bias and limits of agreement (LoA). Concordances between ECG- and PPG-derived HRV metrics are shown in Figure 1 [1]. The highest concordances were observed for mean heart rate (ρc=0.9998), SDANN (ρc=0.9617), VLF power (ρc=0.9613), and SD2 (ρc=0.9523). In contrast, SD1 (ρc=0.6617), rMSSD (ρc=0.6617), and DF-α1 (ρc=0.5919) showed the least agreement. For RF power, SD1, rMSSD, and DF-α1 concordances were lower in the STEMI and STROKE cohorts compared with controls. For all other markers, concordances were similar across the three cohorts. Intraclass correlation coefficients ranged from 0.6318 for DF-α1 to 0.9998 for mean heart rate. Agreement was rated excellent for seven (50%), good for three (21%), moderate for four (29%), and poor for none of the markers. No systematic deviation was observed, with deviations close to zero in all analyses. Near perfect agreement was found for VLF and SD2, whereas DCt4, SDNN, SDANN, HRVi, and DF-α2 showed substantial agreement. In contrast, little agreement was observed for rMSSD and SD1.
In addition, the concordance between the ECG- and PPG-derived power content in arbitrarily overlapping frequency bands was calculated to evaluate a possible relationship between the HRV spectral frequency and the respective concordance. As shown in Figure 2 [1], an inverse relationship was observed between HRV spectral frequency and concordance between ECG- and PPG-derived HRV metrics (r=-0.94, p<0.0001). This trend was observed in all three cohorts.

HR parameters derived from the smartwatch offer a practical alternative
In conclusion, the study provides sufficient evidence that the calculation of HRV markers from the PPG signal of a smartwatch is possible under resting conditions. Agreement between smartwatch-derived HRV and high-resolution ECG-derived HRV is excellent for low-frequency parameters but only moderate for high-frequency metrics, especially in patients with known cardio- or cerebrovascular disease. Future studies are needed to validate these results in real-world situations.
Literature:
- Theurl F, et al: Smartwatch-derived heart rate variability: a head-to-head comparison with the gold standard in cardiovascular disease. European Heart Journal 2023; doi: https://doi.org/10.1093/ehjdh/ztad022.
- Task Force of the ESC: Heart rate variability standards of measurement, physiological interpretation, and clinical use. Circulation 1996; 93:1043-1065.
- Corr P, et al: Mechanisms Controlling Cardiac Autonomic Function and Their Relation to Arrhythmogenesis. New York: Raven Press; 1986.
- Lown B, Verrier RL: Neural activity and ventricular fibrillation. N Engl J Med 1976; 294: 1165-1170.
- Kleiger RE, et al: Decreased heart rate variability and its association with increased mortality after acute myocardial infarction. Am J Cardiol 1987; 59: 256-262.
- Adamson PB, et al: Continuous autonomic assessment in patients with symptomatic heart failure: prognostic value of heart rate variability measured by an implanted cardiac resynchronization device. Circulation 2004; 110: 2389-2394.
- Gerritsen J, et al: Impaired autonomic function is associated with increased mortality, especially in subjects with diabetes, hypertension, or a history of cardiovascular disease: the Hoorn study. Diabetes Care 2001; 24: 1793-1798.
- Yperzeele L, et al: Heart rate variability and baroreceptor sensitivity in acute stroke: a systematic review. Int J Stroke 2015; 10: 796-800.
- Sassi R, et al: Advances in heart rate variability signal analysis: joint position statement by the e-Cardiology ESC Working Group and the European Heart Rhythm Association co-endorsed by the Asia Pacific Heart Rhythm Society. Europace 2015; 17: 1341-1353.
- Peng CK, et al: Quantification of scaling exponents and crossover phenomena in nonstationary heartbeat time series. Chaos 1995; 5: 82-87.
- Richman JS, Moorman JR: Physiological time-series analysis using approximate entropy and sample entropy. Am J Physiol Heart Circ Physiol 2000; 278: H2039-H2049.
- Huikuri HV, et al: Abnormalities in beat-to-beat dynamics of heart rate before the spontaneous onset of life-threatening ventricular tachyarrhythmias in patients with prior myocardial infarction. Circulation 1996; 93: 1836-1844.
- Bauer A, et al: Deceleration capacity of heart rate as a predictor of mortality after myocardial infarction: cohort study. Lancet 2006; 367: 1674-1681.
- Schmidt G, et al: Heart-rate turbulence after ventricular premature beats as a predictor of mortality after acute myocardial infarction. Lancet 1999; 353: 1390-1396.
- Vescio B, et al: Comparison between electrocardiographic and earlobe pulse photoplethysmographic detection for evaluating heart rate variability in healthy subjects in short- and long-term recordings. Sensors (Basel) 2018; 18: 844.
- Hernando D, et al: Validation of the apple watch for heart rate variability measurements during relaxation and mental stress in healthy subjects. Sensors (Basel) 2018; 18:2619.
- Miller DJ, Sargent C, Roach GD: A validation of six wearable devices for estimating sleep, heart rate and heart rate variability in healthy adults. Sensors (Basel) 2022; 22: 6317.
CARDIOVASC 2023; 22(3): 46-48