Ischemic heart disease is the result of inadequate coronary blood flow. Direct measurement of absolute blood flow (mL/min) is possible, but has not found its way into routine clinical practice in most cath labs. Recently, a computational fluid dynamics ( CFD ) method for predicting flow that distinguishes between inlet, side-branch, and outlet flow during angiography has been described. A recent study has now evaluated a new method that regionalizes flow along arterial length.
Ischemic heart disease (IHD) is the leading cause of death worldwide and is the result of coronary blood flow (Q) insufficiency, usually caused by coronary occlusive disease. It includes a variety of clinical syndromes such as symptomatic ischemia (angina), myocardial infarction, and heart failure. Interventional treatments are effective in restoring Q but should target only lesions that result in ischemia. However, no technique is available for routine clinical use in the cardiac catheterization laboratory to measure Q directly. For several decades, cardiologists have relied on indirect surrogate markers, such as thermodilution-derived mean transit time, Doppler-derived flow velocity, and pressure-derived fractional flow reserve (FFR) [2-4] and, more recently, “virtual” FFR (vFFR) calculated from angiographic images [5]. All of these methods have strengths and weaknesses, but none measures “absolute” Q in mL/min.
Two methods have been developed to quantify Q: The first, continuous infusion thermodilution (CIT), is the most established and validated method and uses the Rayflow™ infusion catheter [6,7]. The second, virtuQ™, derives Q from a CFD simulation based on 3D angiography anatomy and pressure wire measurements. Both methods also quantify absolute microvascular resistance (Rmicro), providing a comprehensive assessment of the entire coronary circulation. A limitation of the CFD method was that only the main vessel was considered and the flow in the side branches was not taken into account [8]. This may be acceptable for the calculation of vFFR, which interrogates only the effects of a localized lesion, but not for the calculation of Q, which depends on the lesion, side branches, and microvessel structure [9].
A recent study described a porous wall simulation method using established morphometric scaling laws and case-specific knowledge of arterial taper to allow blood to exit the main vessel in proportion to the flow of the side branches [9]. A limitation of this approach was that the flow of the side branches was diffusely distributed along the entire length of the main vessel. Therefore, this approach failed to capture the hemodynamic effects of a large volume of regionalized flow loss in the large lateral arterial branches. A recent study describes a novel method that attempts to correlate “leakage” in side branches with areas of significant bifurcations, and therefore represents the flow pattern commonly encountered in real coronary arteries. The objective was to validate this new method using CIT measurements and to compare the results with those of the homogeneous CFD method [1].
Clinical data collection
FFR was measured in the arteries of interest using standard technology (PressureWire™) and a maximum tolerated signal drift of 2 mmHg [10], the Rayflow™ infusion catheter, and the Coroventis™ system [6,7] were used to quantify Q (QCIT) and Rmicro (RmicroCIT). Thermodilution measurements were made in the proximal coronary artery, whereas pressure measurements were made under salt-induced hyperemia 6 cm distal to the tip of the infusion catheter [7].
Coronary blood flow simulation
Two angiographic projections of the vessel of interest, taken ≥30° apart and during end-diastole, were used to reconstruct coronary anatomy. Image selection and correction of table motion between angiography runs were performed manually, whereas centerline tracking and vessel edge detection were performed semiautomatically using the contrast gradient for both images and with manual correction as needed. Finally, a rigid, axisymmetric 3D geometry representing the patient’s anatomy was automatically created. The inlet of the reconstructed arteries corresponded to the site of invasive QCIT and Pa measurement, whereas the outlet corresponded to the site of Pd. Invasive pressure measurements were used to define inlet and outlet boundary conditions. The CFD simulation was performed using standard blood parameters (density 1056 kg/m3; viscosity 0.0035 Pa s) modeling steady, laminar flow of a Newtonian fluid [11,12].
Side branch flow simulation
In the current study, flow in side branches was simulated by modeling arterial reconstructions with a porous wall boundary. This allowed loss of flow from the main vessel lumen. The size of the side branches was derived from the taper of the main vessel using Murray’s law [13], which relates the diameters (D) of the main vessel (PV) and the side branches (DB) around a branch:
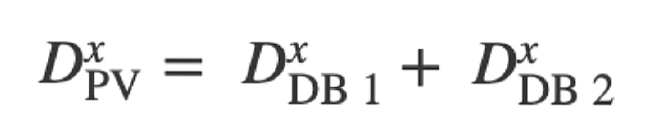
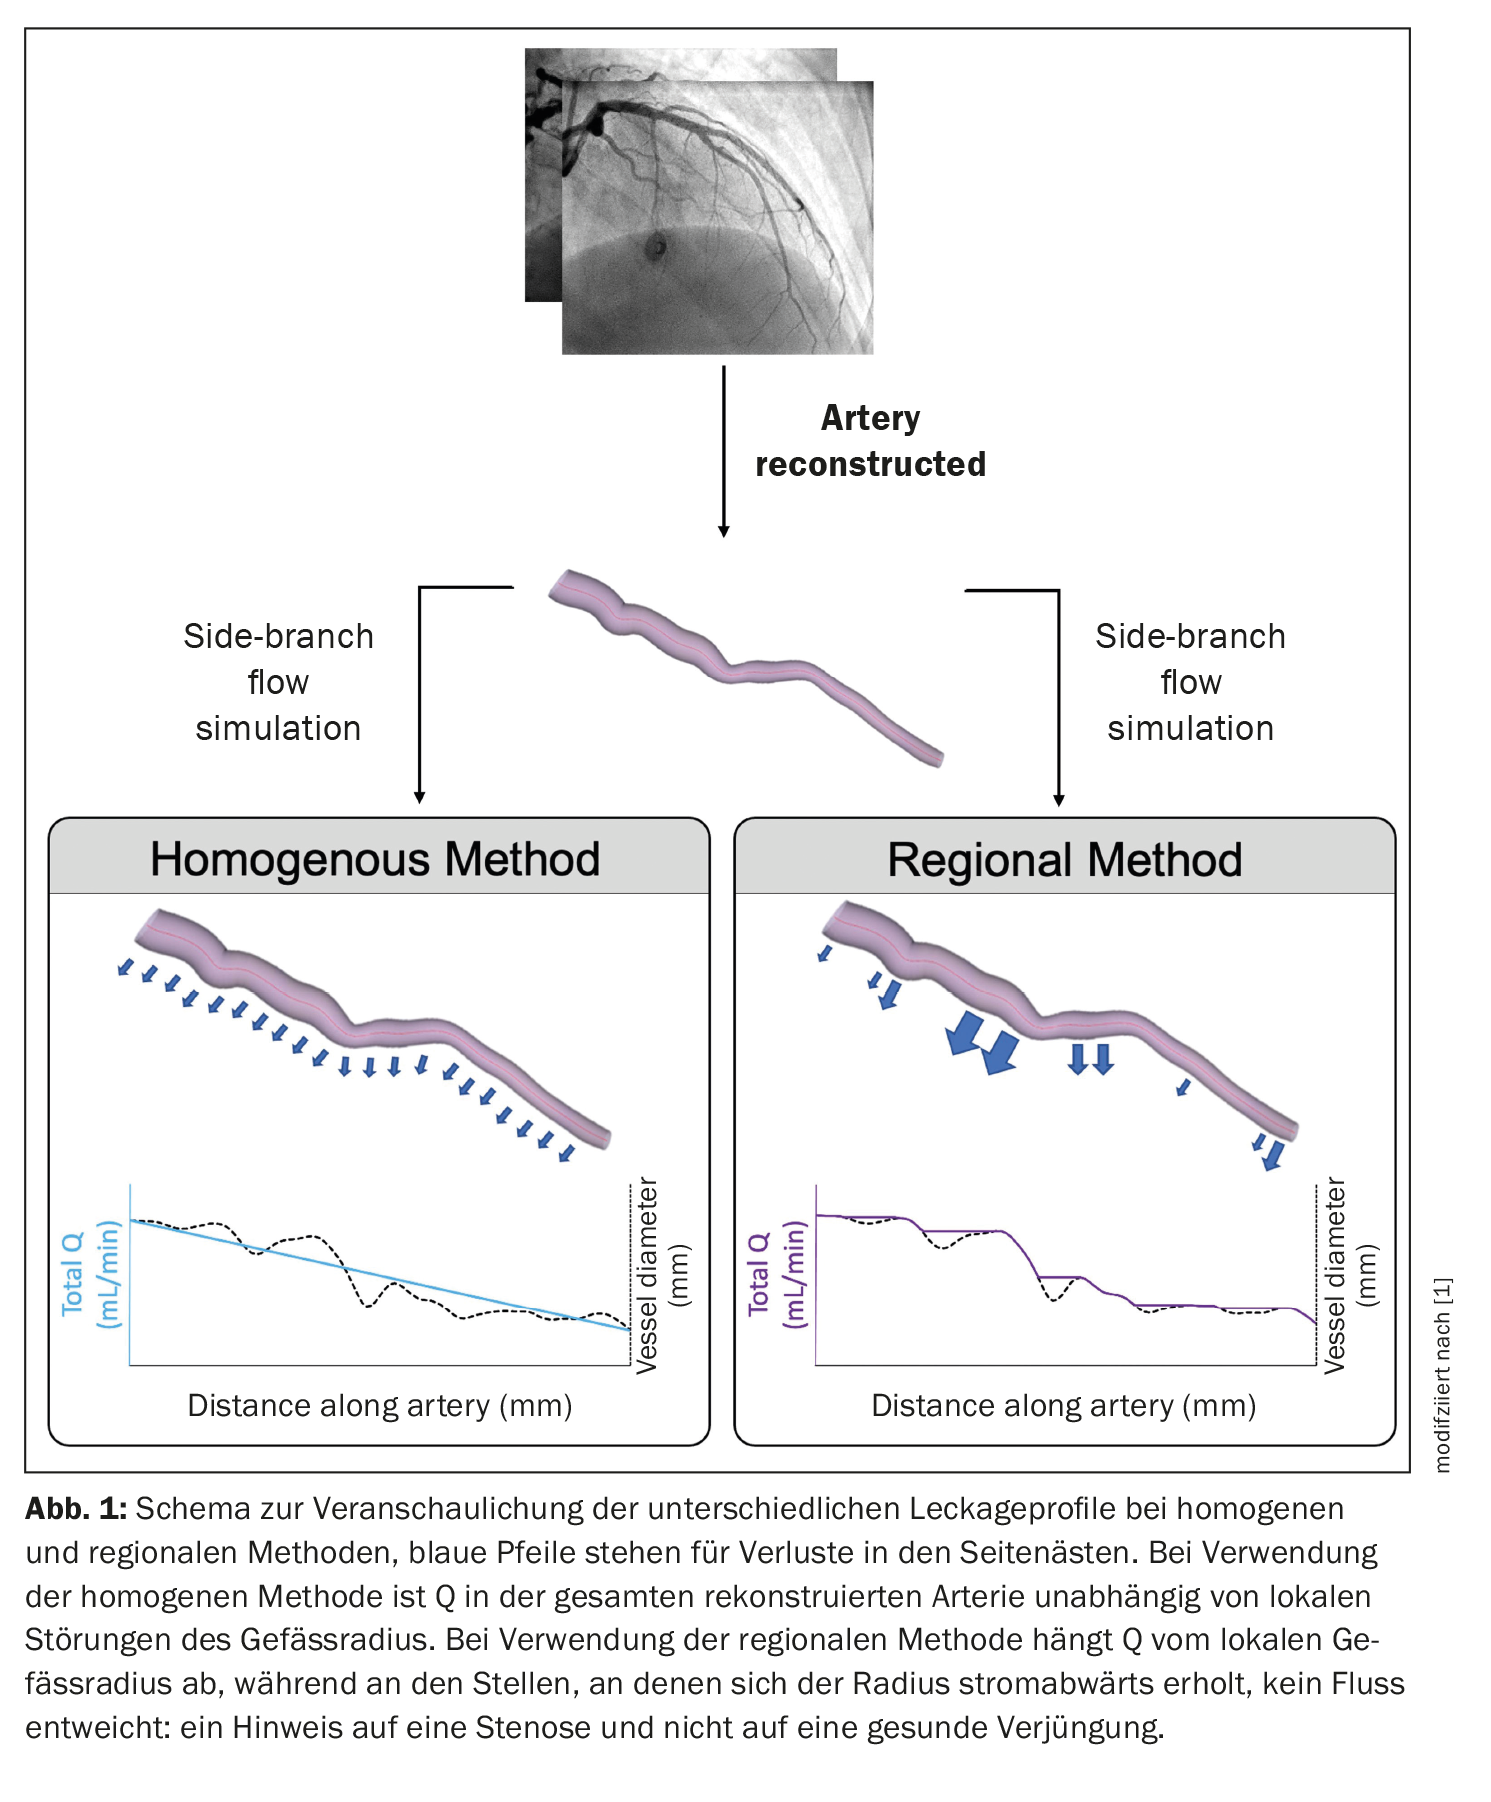
where “x” represents a constant whose value varies between 2.0 and 3.0 [14–16]. The extent of side branch flow depended on the value used for this proportionality constant and the method used to distribute side branch losses (homogeneous vs. regional). The objective was to compare the accuracy of the homogeneous and regional methods with the invasively derived masses. The homogeneous porous wall method distributed side branch losses uniformly along the entire length of the reconstructed vessel and was not affected by local tapering. In the regional porous wall method, side-branch flow losses were distributed proportionally to the local taper of the healthy vessel. This was done to better regionalize Q. In healthy vessels, regional rejuvenation occurs at branch points. Therefore, this method should more accurately regionalize blood flow in the in vivo artery. To distinguish the rejuvenation of healthy vessels from the diameter reduction caused by atherosclerotic plaques, a stenosis detection filter was used that excluded porous wall leaks in sections with downstream recovery of vessel diameter (Fig. 1) [1].
Clinical cases
Of the original 48 cases, 27 cases from 20 patients provided complete physiological data sets. Seven patients (35%) were male, mean age was 62 (±10) years, and mean body mass index (BMI) was 25.2 (±3.6) kg/m2. The 27 cases involved the left anterior descending artery (LAD) (n=18), left circumflex artery (Cx) (n=7), and right coronary artery (RCA) (n=2). The mean QCIT was 219 (±61) mL/min, and the median RmicroCIT was 360 [290–450] mmHg min/L. The majority of included cases had minimal epicardial disease, with a mean FFR of 0.87 (±0.08) and only three cases reaching the clinical threshold of FFR significance (≤0.80). The median percent stenosis determined by operator, 2D QCA, and 3D QCA was 10% [0–25%], 16% [0–31%], and 15% [0–33%], respectively. No diffuse epicardial disease was present in any of the included cases. Using a threshold of 460 mmHg min/L25-27, five (25%) patients had clinically significant MVD assessed by RmicroCIT.
The method of homogeneous porous wall boundary
The homogeneous porous wall confinement method yielded a mean QCFD of 219 (±86) mL/min. There was a statistically significant correlation between QCFD and QCIT (r=0.473, p=0.006), passing and Bablok regression determined constant and proportional differences between techniques (c coefficient -202, 95% CI -633 to -20; m coefficient 2.03, 95% CI 1.15 to 4.07), the mean delta between techniques was zero, and the 95% Bland-Altman limits of agreement were -168 to +168 mL/min. The proportional differences between QCFD and QCIT were characterized by an increase in bias at higher flow rates, visually represented by the Bland-Altman analysis. A significant correlation between RmicroCFD and RmicroCIT was also observed (r=0.647, p=0.0001), constant and proportional differences were present (c coefficient -400, 95% CI -950 to -90; m coefficient 2.07, 95% CI 1.15 to 3.67), the mean delta between techniques was +30 mmHg min/L, and the 95% Bland-Altman limits of agreement were -210 to +480 mmHg min/L.
The method of regional porous wall boundary
The regional porous wall boundary method yielded a mean QCFD of 219 (±96) mL/min. The correlation between QCFD and QCIT was significant (r=0.429, p=0.0127), the passing and Bablok regression determined constant and proportional differences between techniques (c coefficient -220, 95% CI -687 to -16; m coefficient 2.12, 95% CI 1.18 to 4.19), the mean delta between techniques was zero, and the 95% Bland-Altman limits of agreement were -175 to +175 mL/min. Agreement between QCFD and QCIT was not better for either homogeneous or regional techniques (t=0.0023, p=0.998). A significant correlation between RmicroCFD and RmicroCIT was also observed (r=0.586, p=0.0006), constant and proportional differences were present (c coefficient -400, 95% CI -1030 to -60; m coefficient 2.09, 95% CI 1.04 to 3.90), the mean delta between techniques was +37 mmHg min/L, and the 95% Bland-Altman limits of agreement were -220 to +540 mmHg min/L. The agreement between RmicroCFD and RmicroCIT was not better for either the homogeneous or regional methods (U=363, p=0.944). At a threshold of 460 mmHg min/L, seven (35%) patients had clinically significant MVD assessed by RmicroCFD. Using RmicroCIT as the gold standard measurement, the sensitivity, specificity, positive predictive value, and negative predictive value of the CFD technique were 80%, 80%, 57%, and 92%, respectively.
Determinants of compliance
Certain patient and vessel characteristics appeared to influence the agreement between CFD and invasive measurements. For homogeneous resp. regional porous wall boundary methods, Q agreement correlated significantly with transverse pressure drop (Pa-Pd) (r=0.449, p=0.0094; r=0.391, p=0.0217), FFR (r=-0.399, p=0.0196; r= -0.334, p=0.0441) and percent stenosis assessed by 2D (r=0.355, p=0.0345; r=0.472, p=0.0065) and 3D QCA (r=0.369, p=0.0292; r=0.489, p=0.0048). This meant, for both the homogeneous and regional methods, that the agreement between QCFD and QCIT improved for cases with greater disease burden identified by pressure wire studies, 2D QCA, and 3D QCA. For the regional method, Q agreement also correlated with visually assessed stenosis (r=0.371, p=0.0282).
For the Rmicro method, both the homogeneous and regional methods correlated with transverse pressure drop (r=0.359, p=0.0330; r=0.340, p=0.0415, respectively) and FFR (r=-0.368, p=0.0295; r=-0.364, p=0.0310, respectively), but no effect was observed for stenosis assessment. This meant, for both the homogeneous and regional techniques, that agreement between RmicroCFD and RmicroCIT improved in cases with greater disease burden assessed by pressure wire testing, whereas disease burden assessed by percent stenosis was not associated with agreement.
Intraoperator variability
For the homogeneous and regional porous wall confinement methods, QCFD variability was 7.8% (±4.2%) and 5.6% (±2.7%), respectively. For RmicroCFD, it was 2.6% [4,6–6,1%] and 3.2% [1,9–10,2%], respectively. Intra-observer variability did not differ between homogeneous and regional techniques for either QCFD (U=33, p=0.218) or RmicroCFD (U=45, p=0.739).
Coronary flow at inlet, outlet and side branches regionalizable
In the retrospective study, a regionalized porous wall boundary method was validated to simulate sidearm Q, and the results were compared with those of the original homogeneous method [15]. The main objective was to regionalize the side-arm and main-arm flow. This was achieved without significantly changing the overall flow in the sidearm compared to the homogeneous method. The new regionalized method correlated with the CIT measurements with zero deviation and a 95% limit of agreement of ±175 mL/min. Agreement with invasive clinical measurements was suboptimal, which may be due to the inclusion of multiple INOCA cases with minimal stenosis and pressure gradient.
During angiography and pressure wire assessment, coronary flow can now be regionalized and differentiated at the inlet, outlet, and side branches. The effect of epicardial disease on concordance suggests that the model is most appropriate for cases with stenosis near the side branches.
Literature:
- Taylor DJ MA, et al: Validation of a novel numerical model to predict regionalized blood flow in the coronary arteries. EurHeartJ 2023.
https://doi.org/10.1093/ehjdh/ztac077 - Gould KL, Lipscomb K, Hamilton GW: Physiologic basis for assessing critical coronary stenosis. Instantaneous flow response and regional distribution during coronary hyperemia as measures of coronary flow reserve. Am J Cardiol 1974;33: 87-94.
- De Bruyne B, Paulus WJ, Vantrimpont PJ, et al: Transstenotic coronary pressure gradient measurement in humans: in vitro and in vivo evaluation of a new pressure monitoring angioplasty guide wire. J Am Coll Cardiol 1993;22: 119-126.
- Fearon WF, Balsam LB, Farouque HM, et al: Novel index for invasively assessing the coronary microcirculation. Circulation 2003;107: 3129-3132.
- Ghobrial M, Haley HA, Gosling R, et al: The new role of diagnostic angiography in coronary physiological assessment. Heart 2021;107: 783-789.
- Aarnoudse W, Van’t Veer M, Pijls NH, et al: Direct volumetric blood flow measurement in coronary arteries by thermodilution. J Am Coll Cardiol 2007;50: 2294-2304.
- van’t Veer M, Adjedj J, Wijnbergen I, et al: Novel monorail infusion catheter for volumetric coronary blood flow measurement in humans: in vitro validation. EuroIntervention 2016;12: 701-707.
- Morris PD, Gosling R, Zwierzak I, et al: A novel method for measuring absolute coronary blood flow & microvascular resistance in patients with ischaemic heart disease. Cardiovasc Res 2020;117: 1567-1577.
- Gosling RC, Sturdy J, Morris PD, et al: Effect of side branch flow upon physiological indices in coronary artery disease. J Biomech 2020;103: 109698.
- Pijls NH, van Son JA, Kirkeeide RL, et al: Experimental basis of determining maximum coronary, myocardial, and collateral blood flow by pressure measurements for assessing functional stenosis severity before and after percutaneous transluminal coronary angioplasty. Circulation 1993;87: 1354-1367.
- Morris PD: Computational fluid dynamics modeling of coronary artery disease. PhD thesis. University of Sheffield 2015. https://etheses.whiterose.ac.uk/11772/1/CFD Modelling-of-CAD Morris_
submitted.pdf. - Brown AG, Shi Y, Marzo A, et al: Accuracy vs. computational time: translating aortic simulations to the clinic. J Biomech 2012;45: 516-523.
- Murray CD: The physiological principle of minimum work: I. The vascular system and the cost of blood volume. Proc Natl Acad Sci USA 1926;12: 207.
- Huo Y, Kassab GS: Intraspecific scaling laws of vascular trees. J R Soc Interface 2012;9: 190-200.
- Kamiya A, Togawa T: Optimal branching structure of the vascular tree. Bull Math Biophys 1972;34: 431-438.
- Murray CD: The physiological principle of minimum work: I. The vascular system and the cost of blood volume. Proc Natl Acad Sci U S A 1926;12: 207-214.
CARDIOVASC 2023; 22(1): 32–34