The goal of every study and every statistical test is to reliably demonstrate effects that are actually present and sometimes not clearly apparent at first glance. However, often only a look behind the scenes allows a correct interpretation of statistical results. For example, statistical power as a measure of the significance of negative results in particular should not be disregarded.
How good a study or test is depends on many factors – and is extremely relevant for the interpretation of the results. After all, what good is the most elaborate data processing if the results and conclusions are very likely to be wrong? One measure of the power of a test or study design is statistical power, also known as discriminatory power. No wonder that corresponding analyses are demanded by more and more journals, top performers and reviewers. Roughly speaking, the discriminatory power describes the probability of detecting an effect if it actually exists. Thus, when comparing the weight of mice and elephants, a test with high statistical power would be more likely to produce results suggesting a higher weight of elephants than a test with low statistical power. In this case, the null hypothesis would be: “Mice are equal in weight or heavier than elephants.” This (false) null hypothesis would be correctly rejected by a test with high discriminatory power, but could not be refuted by a test with insufficient discriminatory power. In other words, With high statistical power, the probability of committing a Type II error decreases. But slow down.
Of errors of the first and second kind
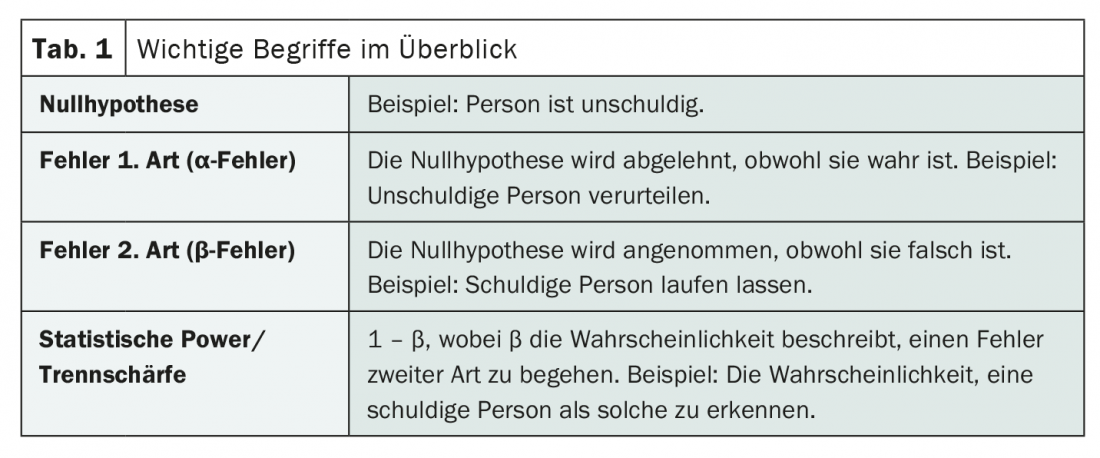
While a correct null hypothesis is rejected in the case of a first kind error (also α-error), a false null hypothesis is assumed in the case of a second kind error (also β-error). The fact that this is quickly forgotten and often leads to confusion is not surprising. A mnemonic can help here: If one assumes the innocence of a person (null hypothesis), the conviction despite innocence would be an error of the first kind. If the person in question were let off and were guilty, on the other hand, an error of the second kind would be committed.
The probability with which such a second type of error – i.e. the erroneous acceptance of the null hypothesis – can be avoided now describes the discriminatory power or statistical power of a test. Mathematically, this can be expressed in consequence as 1 – β, when β is the probability of committing a second kind error. If β is small, the statistical power is high. And vice versa.
Statistical power: what flows in?
In addition to the statistical method used, other factors determine statistical power. For example, it seems logical that a large difference between two populations is less likely to be overlooked than a small one (it is easier to detect the difference in weight between mice and elephants than that between mice and rats). Thus, as the actual difference increases, the discriminatory power also increases. The same applies to a decreasing dispersion. The smaller the data scatter, the better existing differences can be detected. Or: If there were mice weighing 5 tons and elephants weighing 20 grams, the difference in weight would probably also be less easy to prove. An important – and influenceable – factor in this area is the sample size, since the standard error becomes smaller with increasing sample size. Thus, smaller effects are more likely to be separated by a larger sample size. The significance level – i.e. the probability of committing an error of the first type – is also included in the statistical power.
In this framework, it is quite reasonable to assess the discriminatory power of a study design before it is implemented. Because at this point, for example, the sample size can still be adjusted. Power analyses can be used to decide how many subjects are needed to conduct a study in a meaningful way. A power analysis performed after the fact – usually in the absence of significant results – can provide information about how many additional subjects would have been needed, but it is usually too late. Usually a discriminatory power around 80% is chosen, so the probability of missing a significant difference is often around 20%. A classic compromise solution, after all, increasing statistical power to 90% would require about a 30% increase in sample size. The conclusion: a negative study result is not necessarily due to a lack of effect. Perhaps the sample was too small, the dispersion too large, the effect too weak, or the statistical analysis poorly chosen.
Literature:
- StatistikGuru, Version 1.96: Statistical Power. https://statistikguru.de/lexikon/statistische-power.html (last accessed Sept. 27, 2021).
- Bortz J: Statistics – for social scientists. 5th edition: Springer-Verlag Berlin Heidelberg; 1999.
InFo ONCOLOGY & HEMATOLOGY 2021; 9(5): 25.


