
The oncology community is flooded with new data and study results on a daily basis. And one is omnipresent: the p-value. To escape its spell and at the same time stay up to date is like an impossibility. After all, it is he who decides, for example, whether a new drug is classified as effective or not. But what does the p-value actually say exactly?
The most important thing up front: the smaller, the better. This is mostly true in this case and should be known to most people – even if the study of statistics dates back a few years and the interest is limited. Nevertheless, this gross simplification does an injustice to the p-value, because there is much more to it. Much more, which is not so difficult to understand.
Sense and purpose
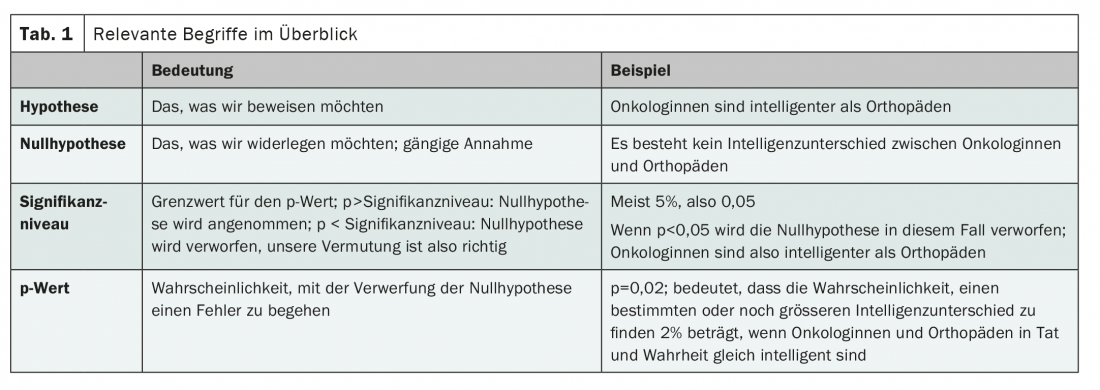
The p-value has exactly one task. Namely, its sole purpose is to either maintain or reject the null hypothesis. For example, the p-value determines whether we accept the hypothesis that female oncologists are more intelligent than orthopedic surgeons. Our null hypothesis in this case would be “female oncologists are equally intelligent as orthopedic surgeons.” If the calculated p-value is smaller than the significance level, which is set in advance, we can assume that our null hypothesis is false, i.e. oncologists are – according to our expectation – more intelligent than orthopedists. On the other hand, if the p-value is greater than the significance level, we must retain the null hypothesis; the presumed difference in intelligence is not statistically significant.
And what is the significance level now, please?
The significance level is set by the study authors themselves, in most cases at 5%. This is how the famous picture p<0.05 comes about, which we are very familiar with from various publications – and often what we want to see. Because p<0.05 means that the null hypothesis can be rejected at the specified significance level of 5%, oncologists are more intelligent than orthopedists. The selected significance level represents a threshold value. It describes the tolerated probability of making a mistake with the rejection of the null hypothesis. With a significance level of 5%, we assume in our example for the acceptance of our conjecture (that oncologists are more intelligent than orthopedists) that the risk of making a false statement in this respect must be smaller than 5%. If we lower the critical value to 1%, the probability of error is correspondingly lower, but it is also more difficult to confirm our hypothesis. Conversely, we can increase the significance level to 50% – with the consequence that our statement has a 50% probability of being false and is therefore irrelevant.
By understanding the significance level, it is now easy to also understand the statement of the p-value. This is because it indicates the risk of making a mistake by rejecting the null hypothesis. It is thus a measure of the probability of the outcome or even more extreme outcomes if the null hypothesis is true. Thus, if our study concludes that oncologists have an average of 20 IQ points more than orthopedists, the p-value is a measure of the likelihood that we observe an IQ difference of 20 or more IQ points in our sample, when in fact there is no IQ difference at all. If the p-value is 0.01, the probability of making such an error is 1%. In this case, if there is no IQ difference in the population, it is only 1% likely to draw a sample that is 20 IQ points or more apart. All clear?
Source: Fahrmeir L, et al: Statistics: The Way to Data Analysis. 8th ed. Springer Spektrum; 2016.
InFo ONCOLOGY & HEMATOLOGY 2021; 9(3): 26.
InFo PNEUMOLOGY & ALLERGOLOGY 2021; 3(4): 27.